JMH Visualizer 1.1.0 Released
I’ve invested a considerable amount of time into modernizing JMH Visualizer and the related Gradle plugin.
JMH Visualizer has been my go-to solution for visualizing JMH benchmark results for quite a while. It converts JMH result files into interactive charts, and runs entirely in the browser.
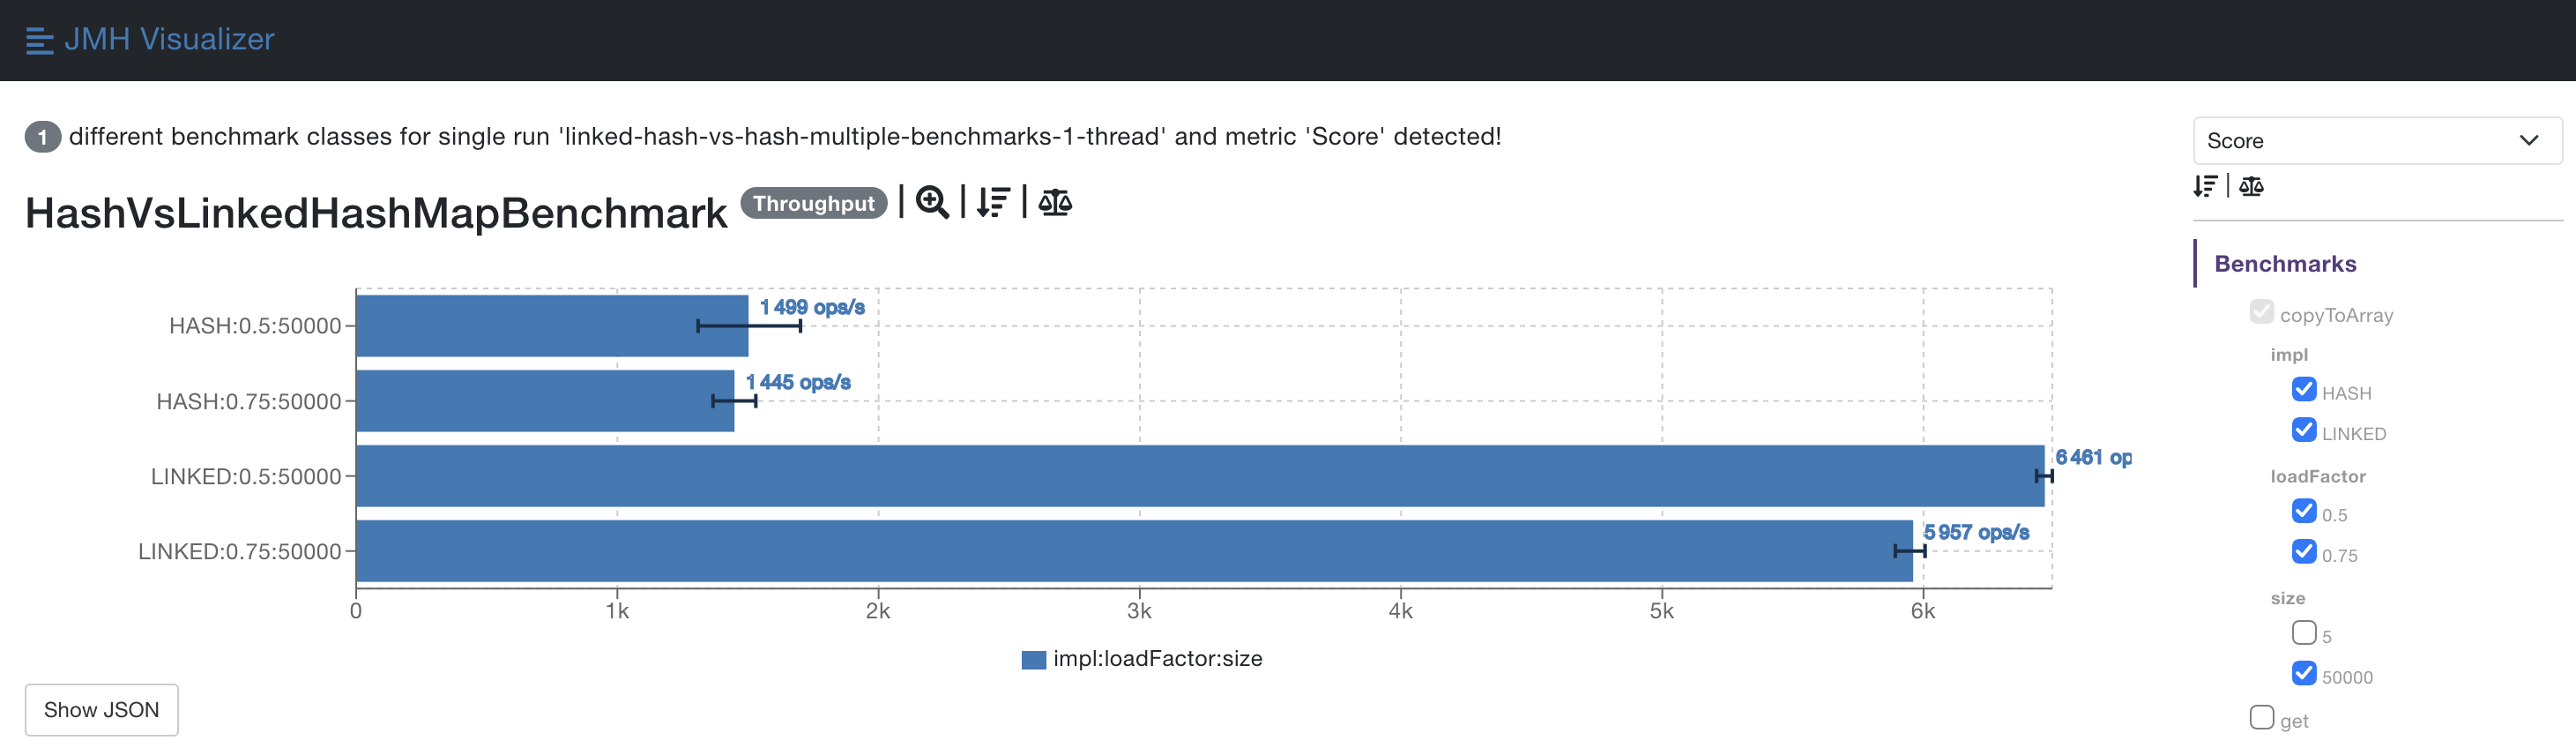
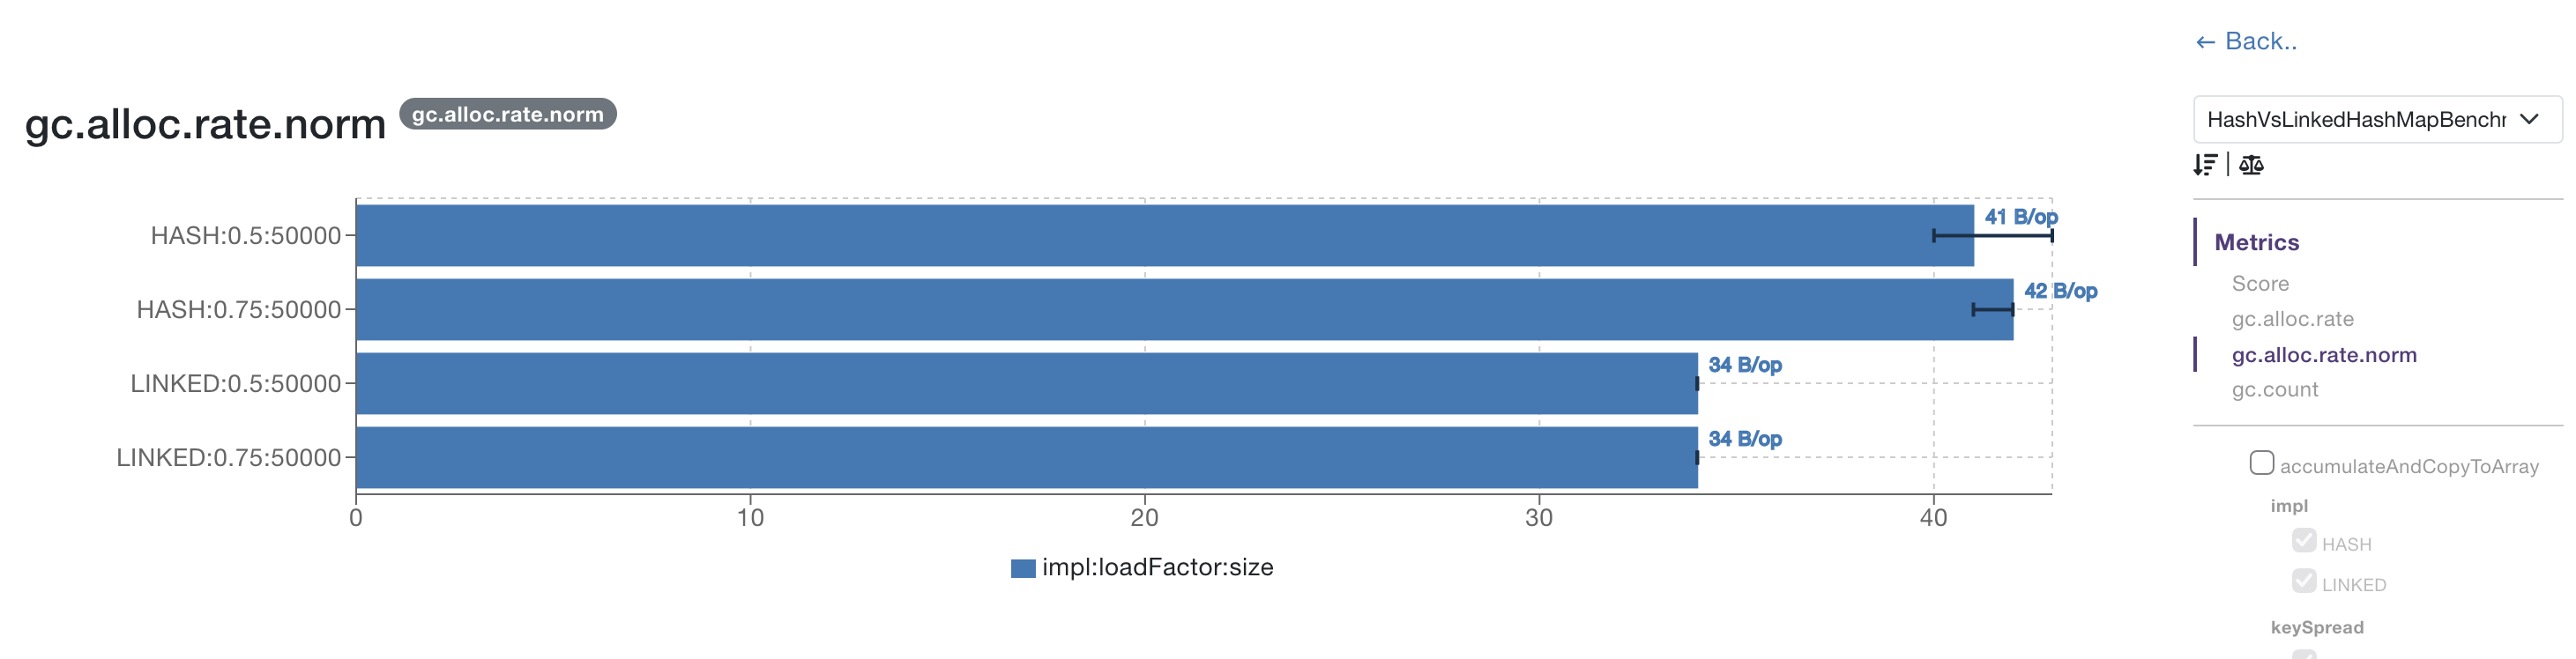
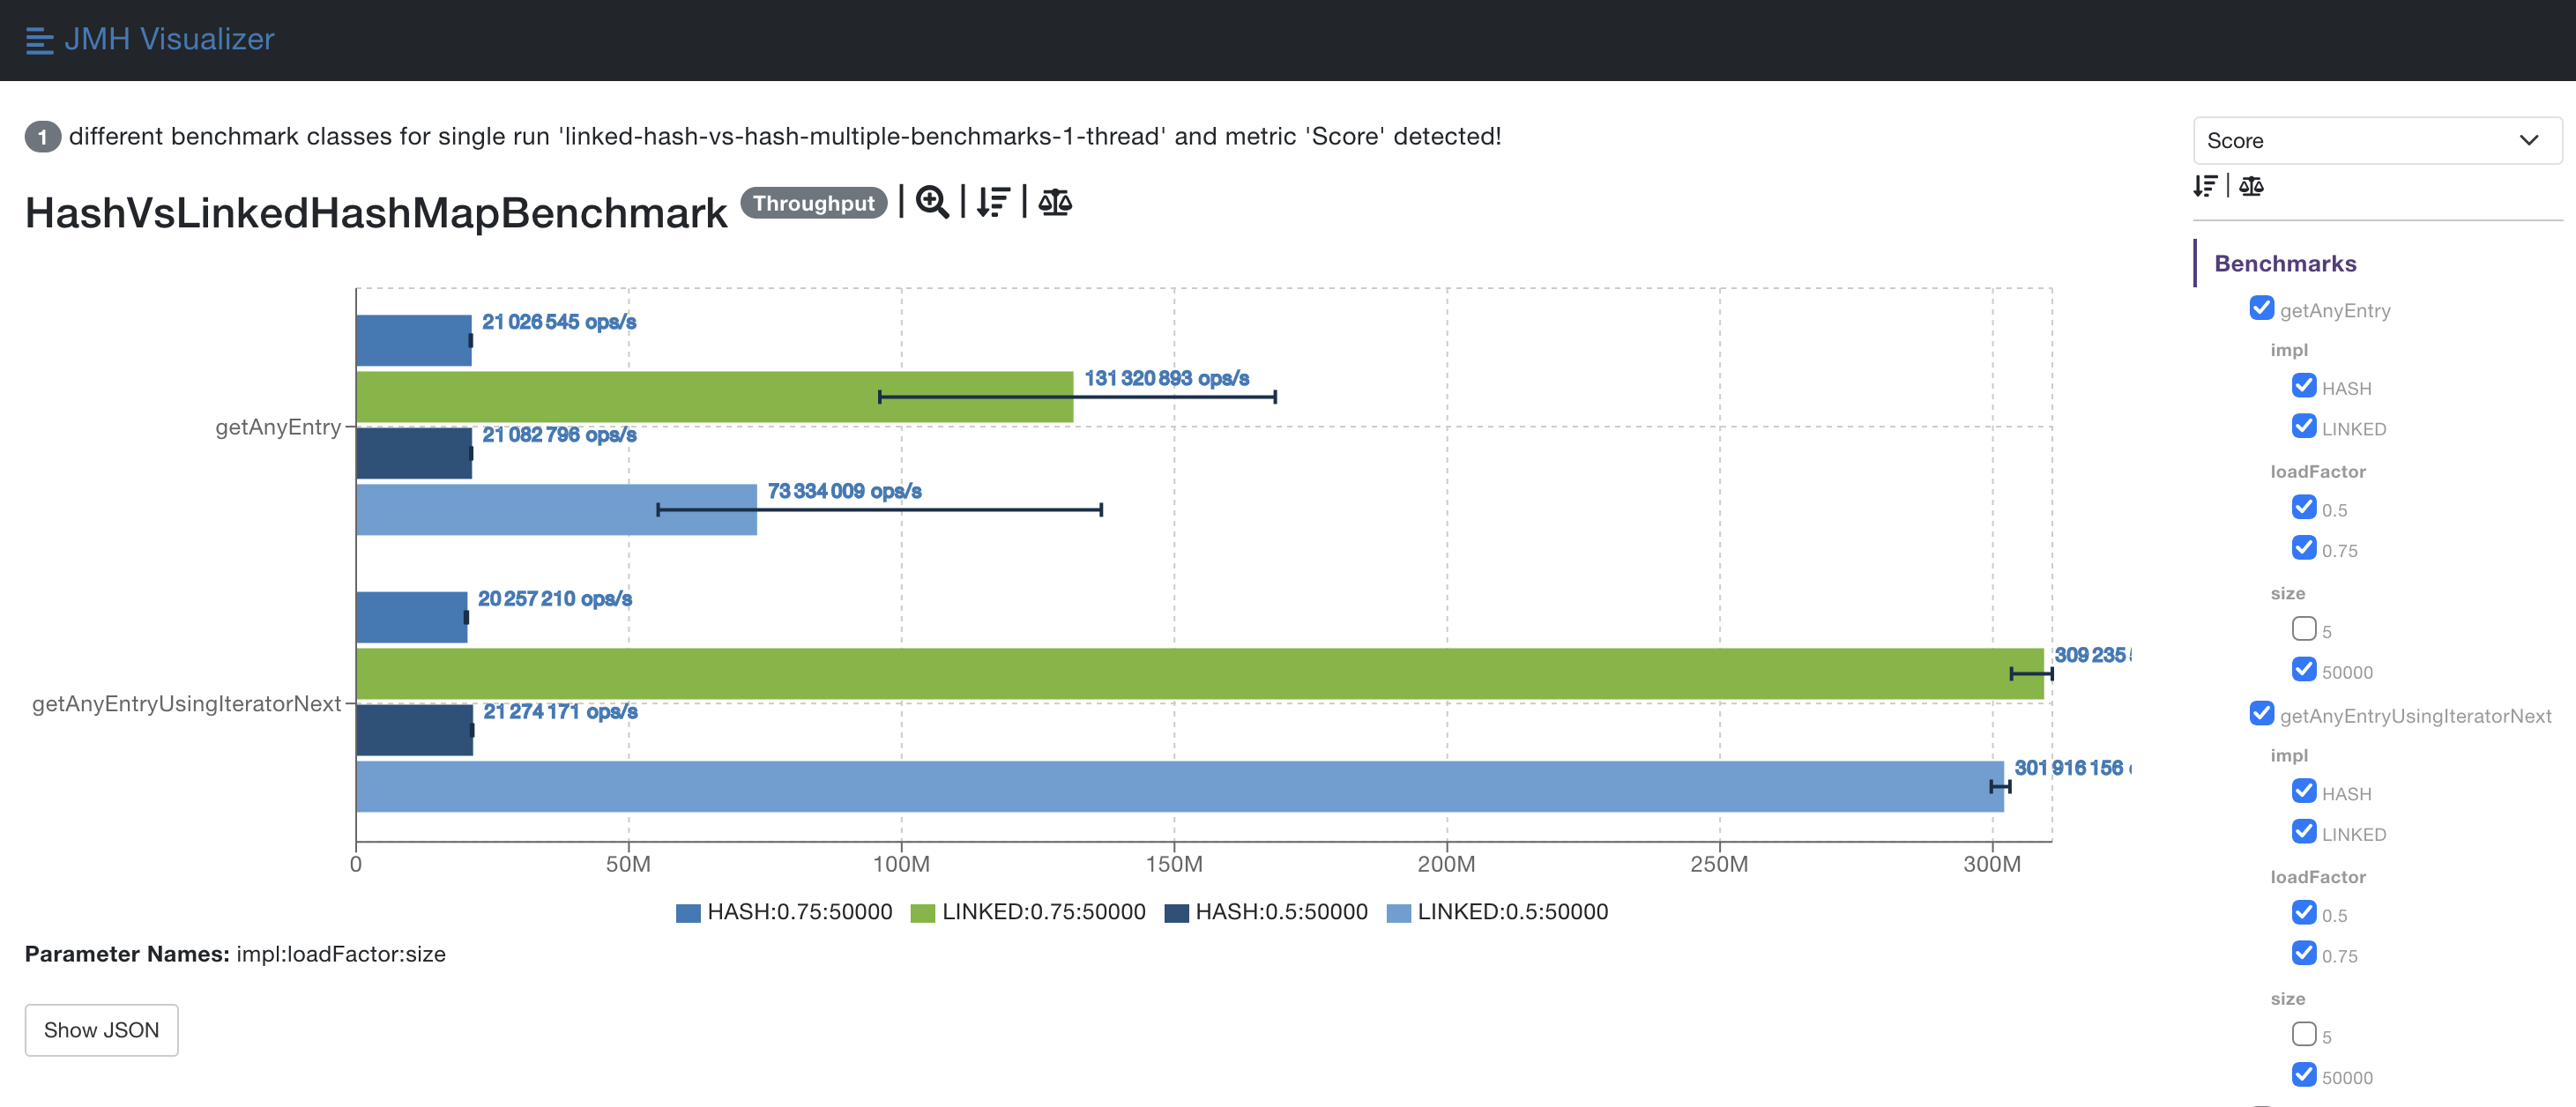
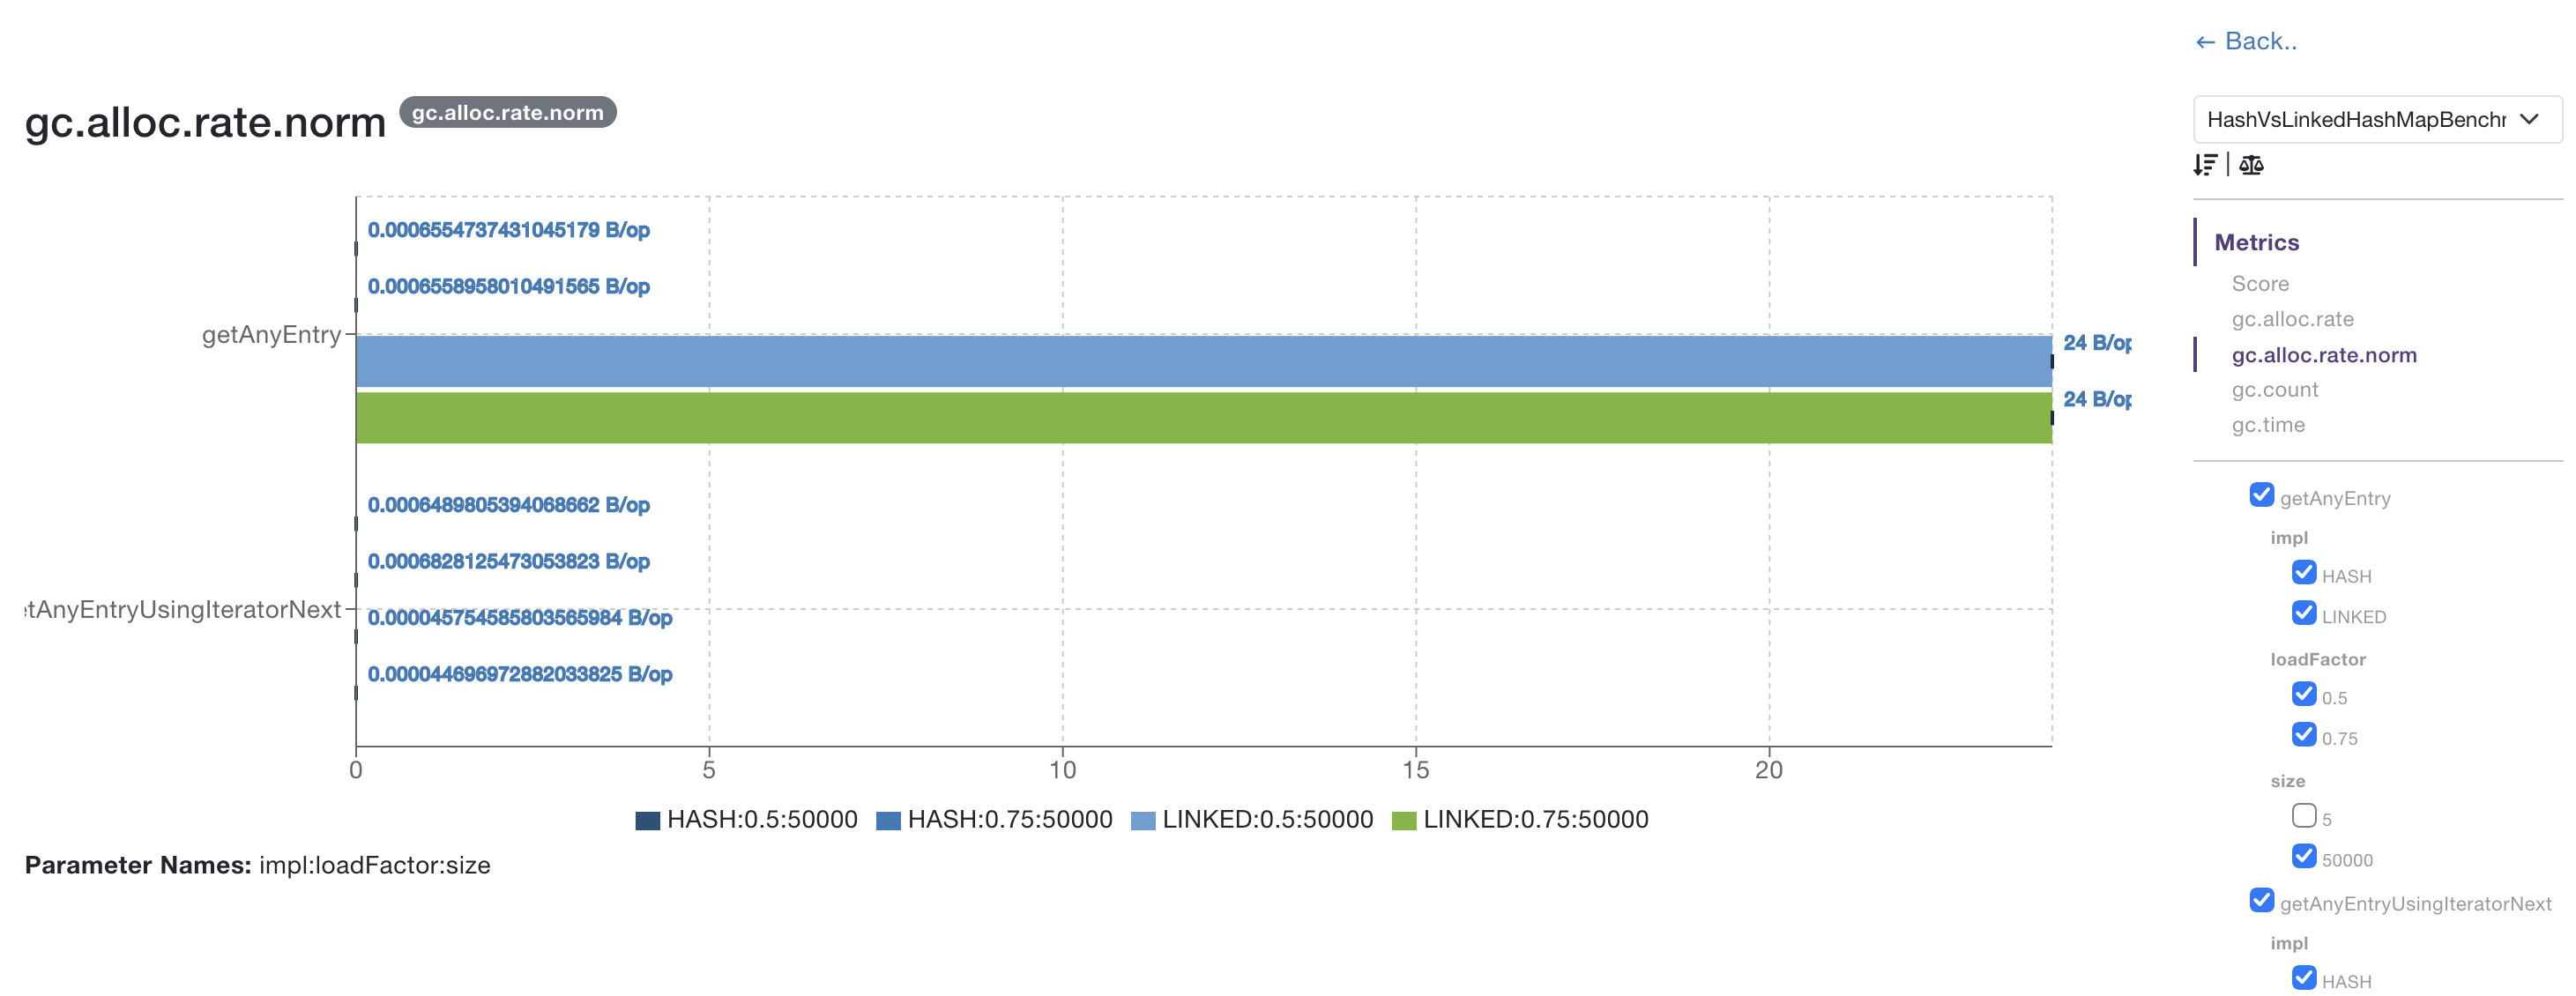
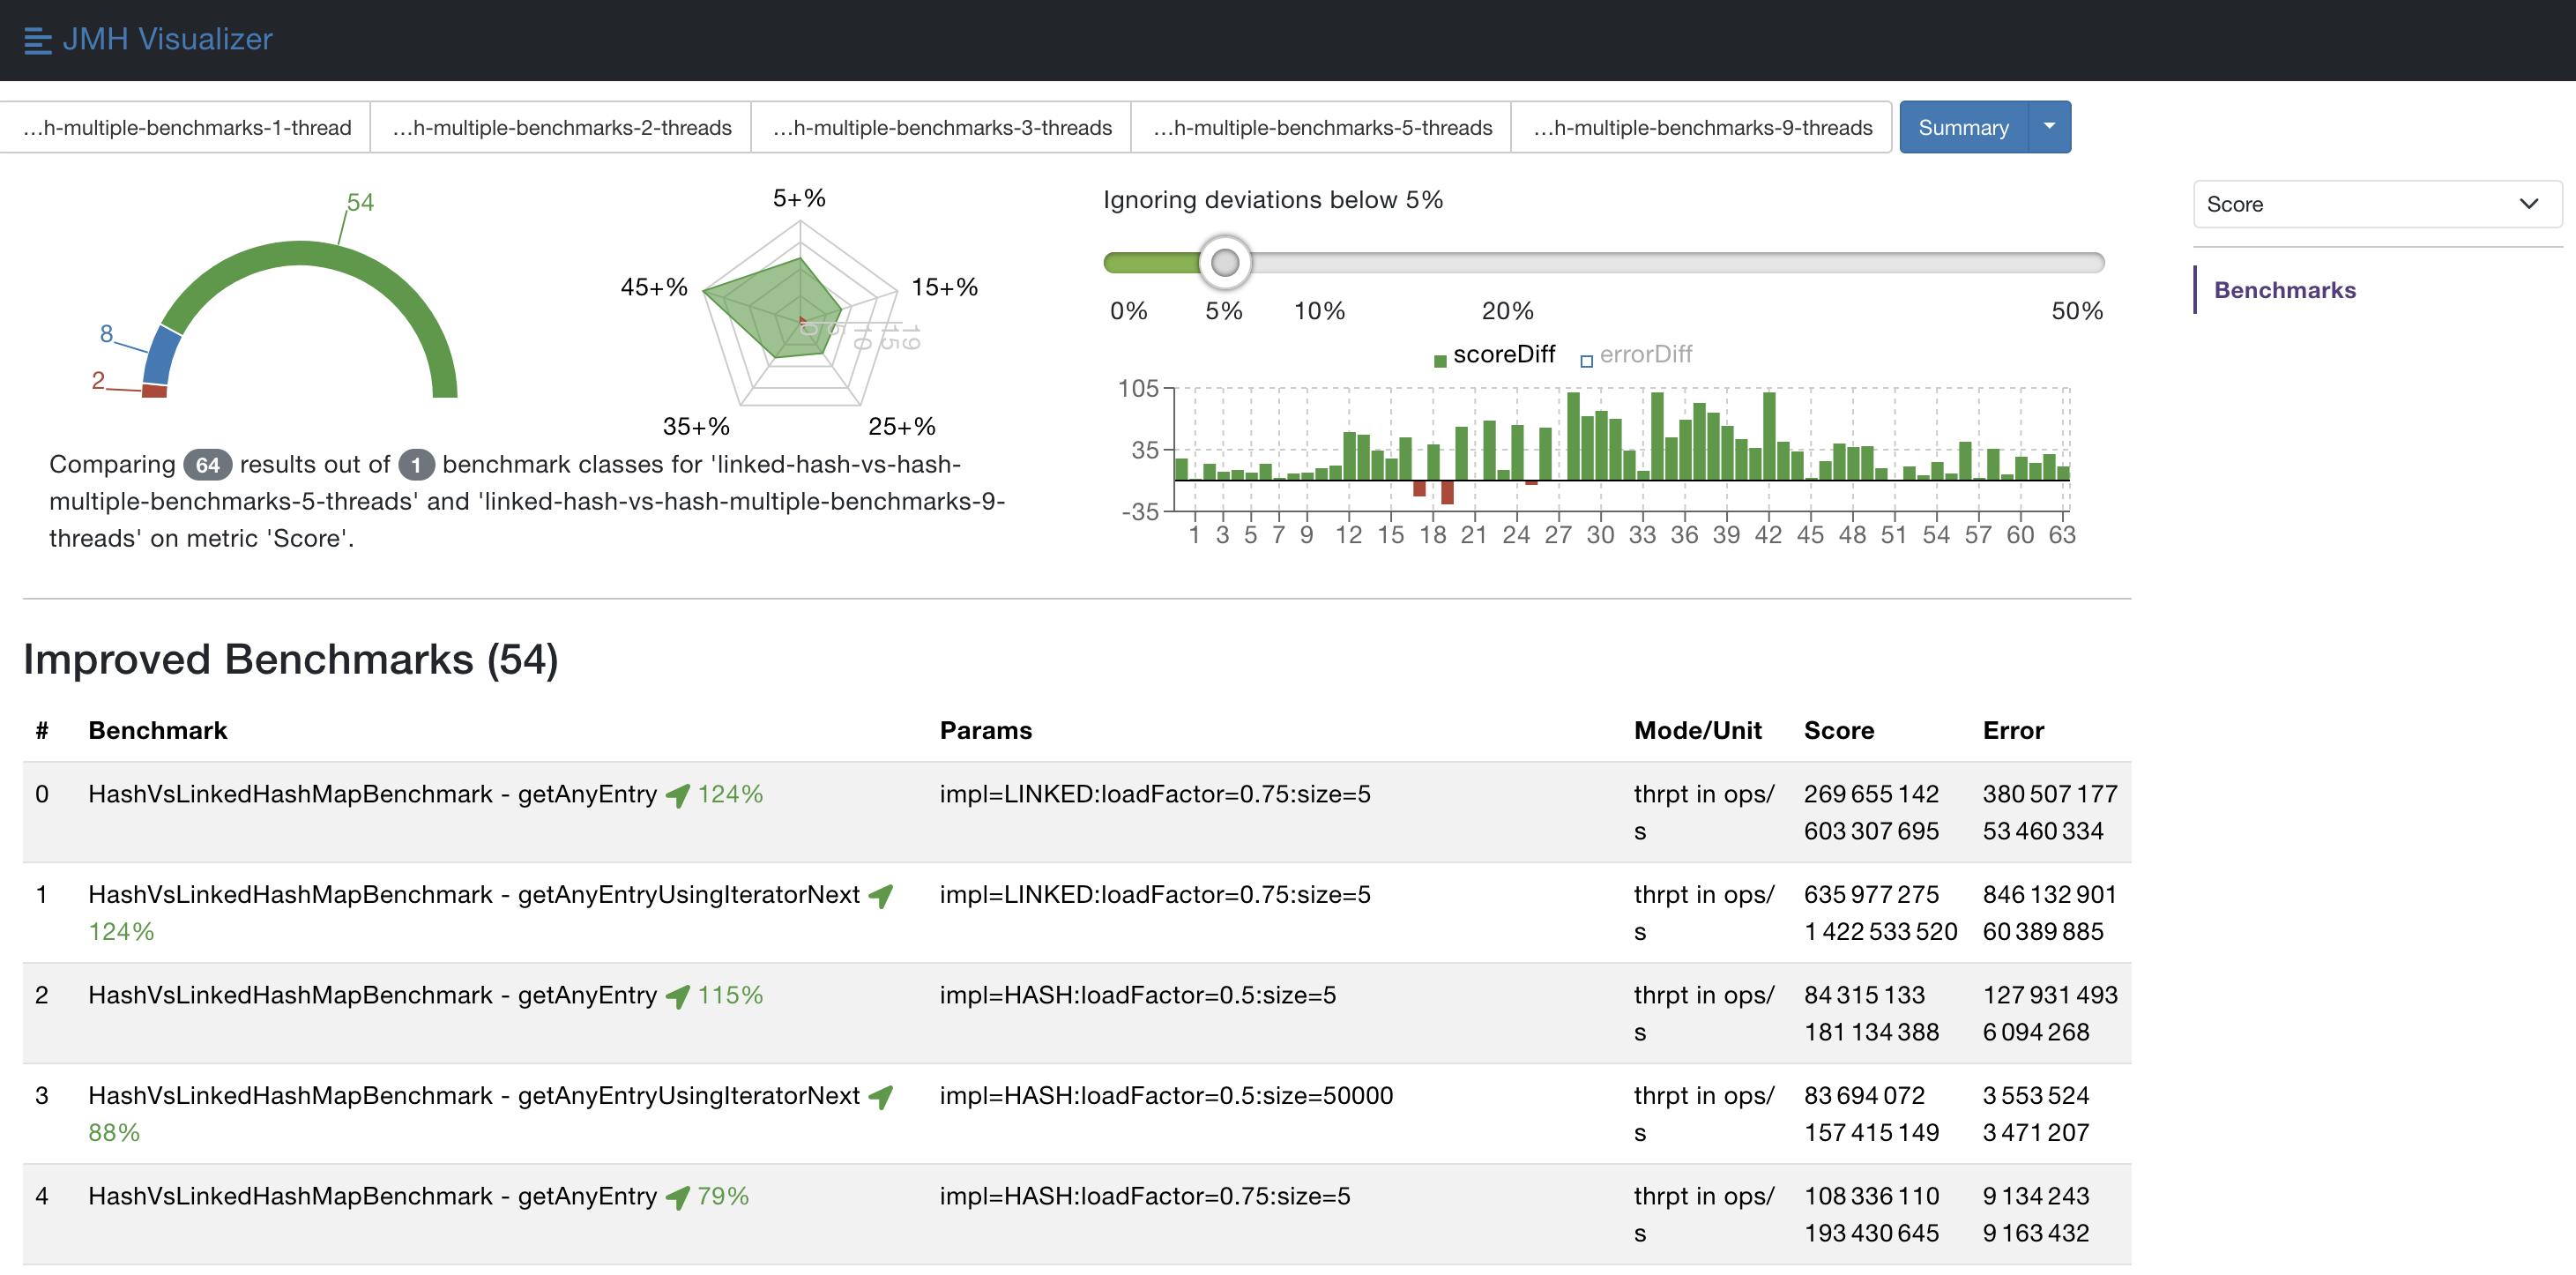
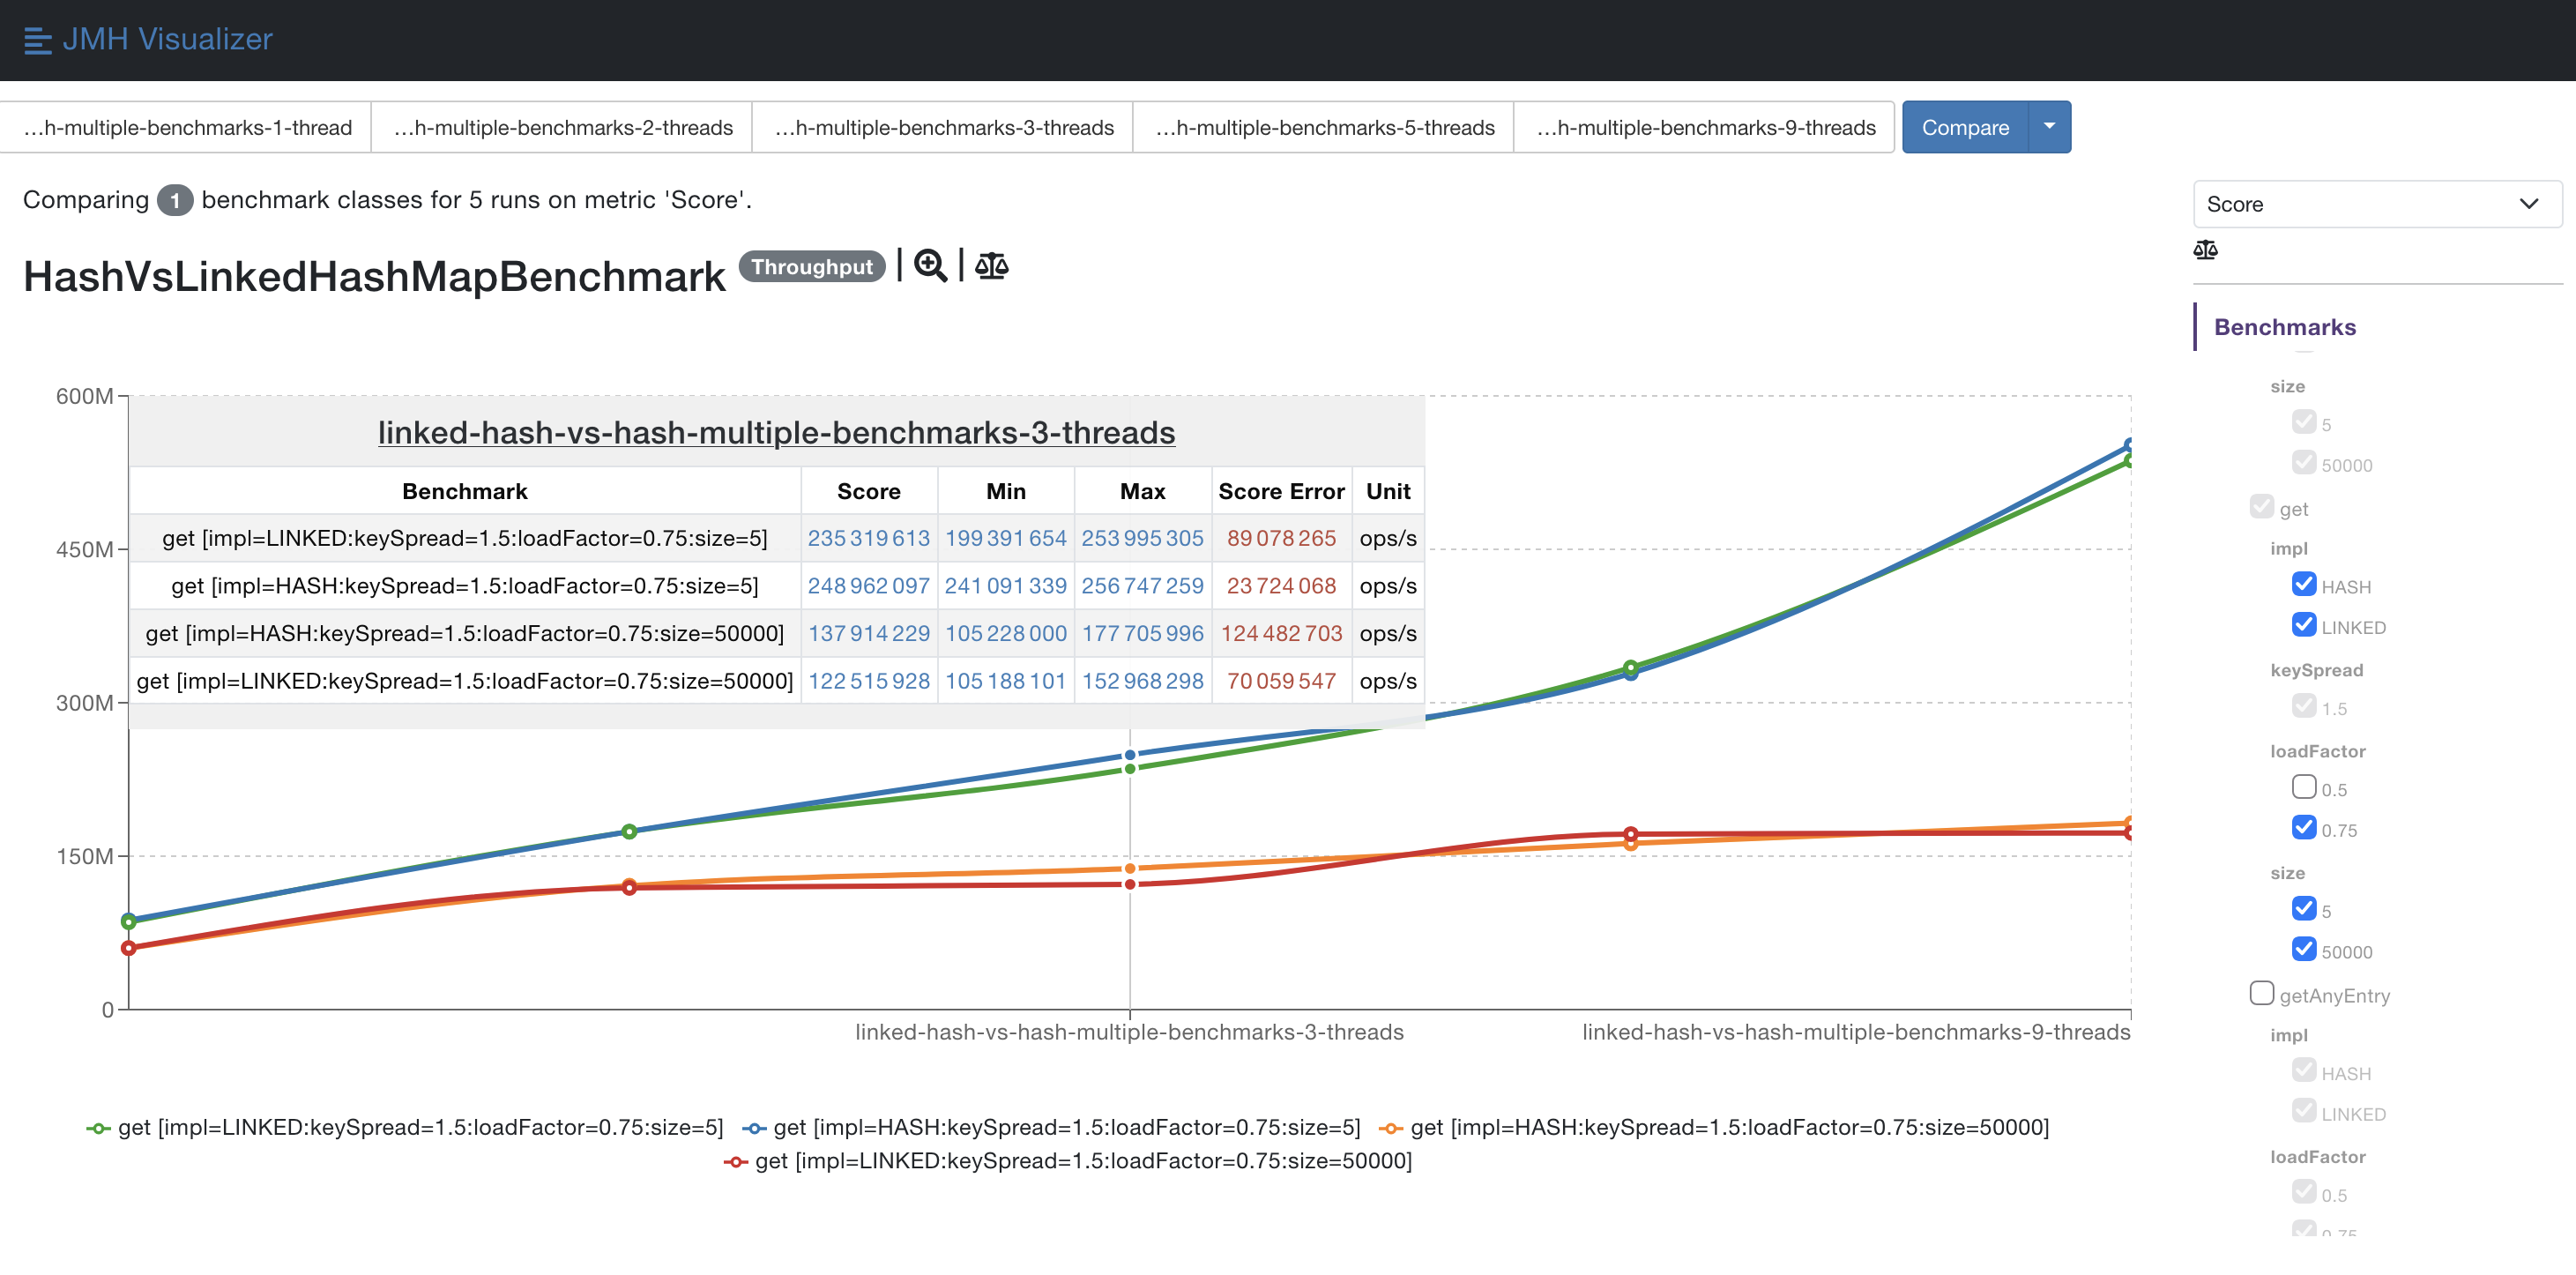
If you are using JMH regularly you should definitely have a look. The following screenshots from a HashMap related benchmark are meant to make this as easy as possible:
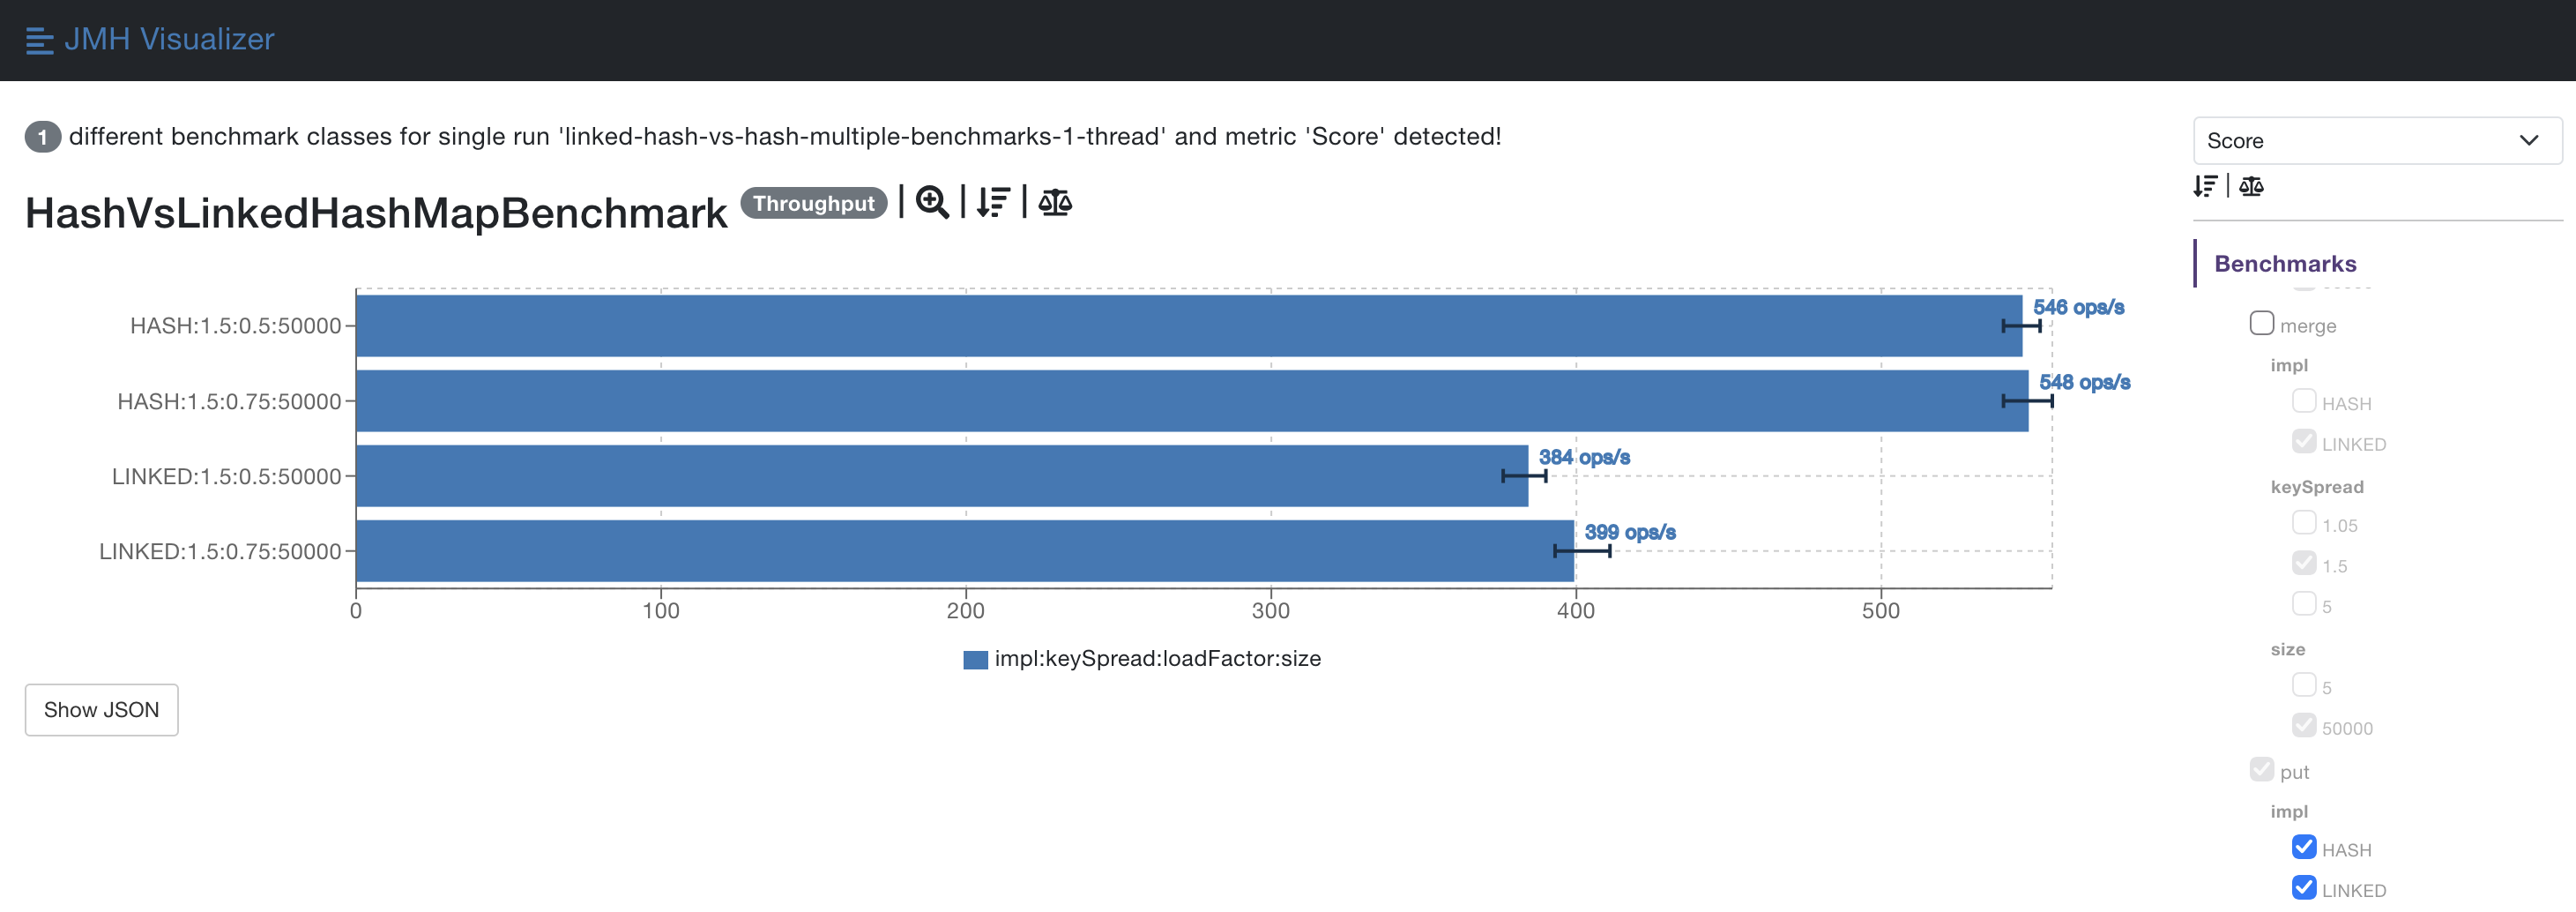
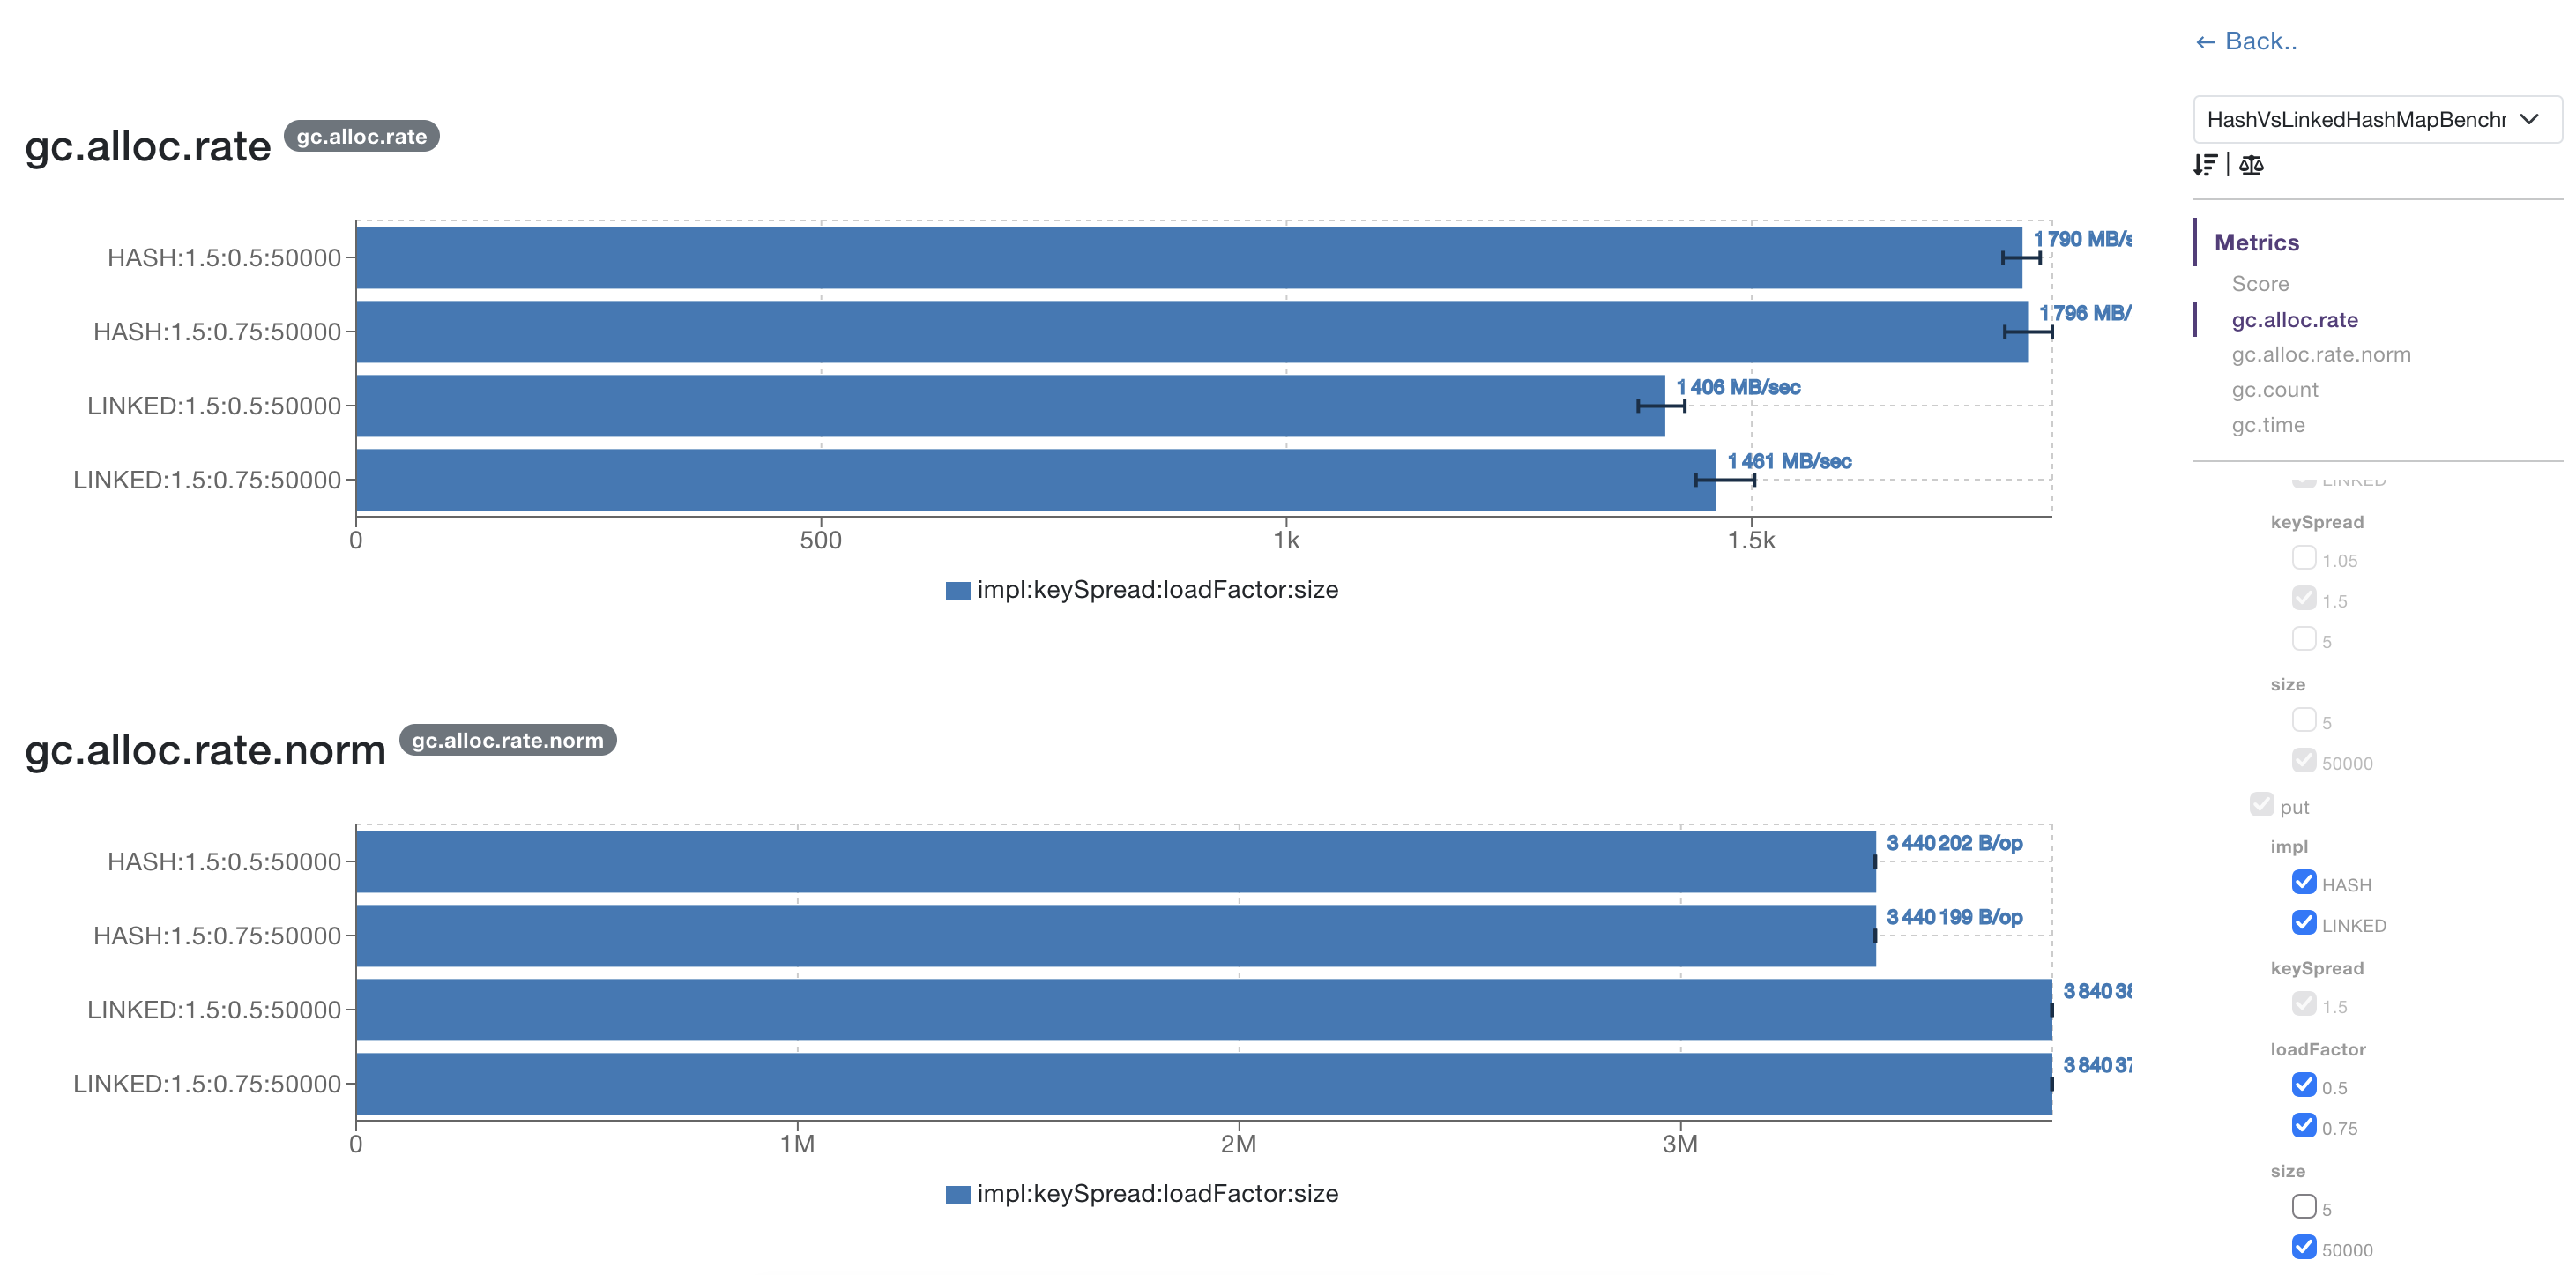
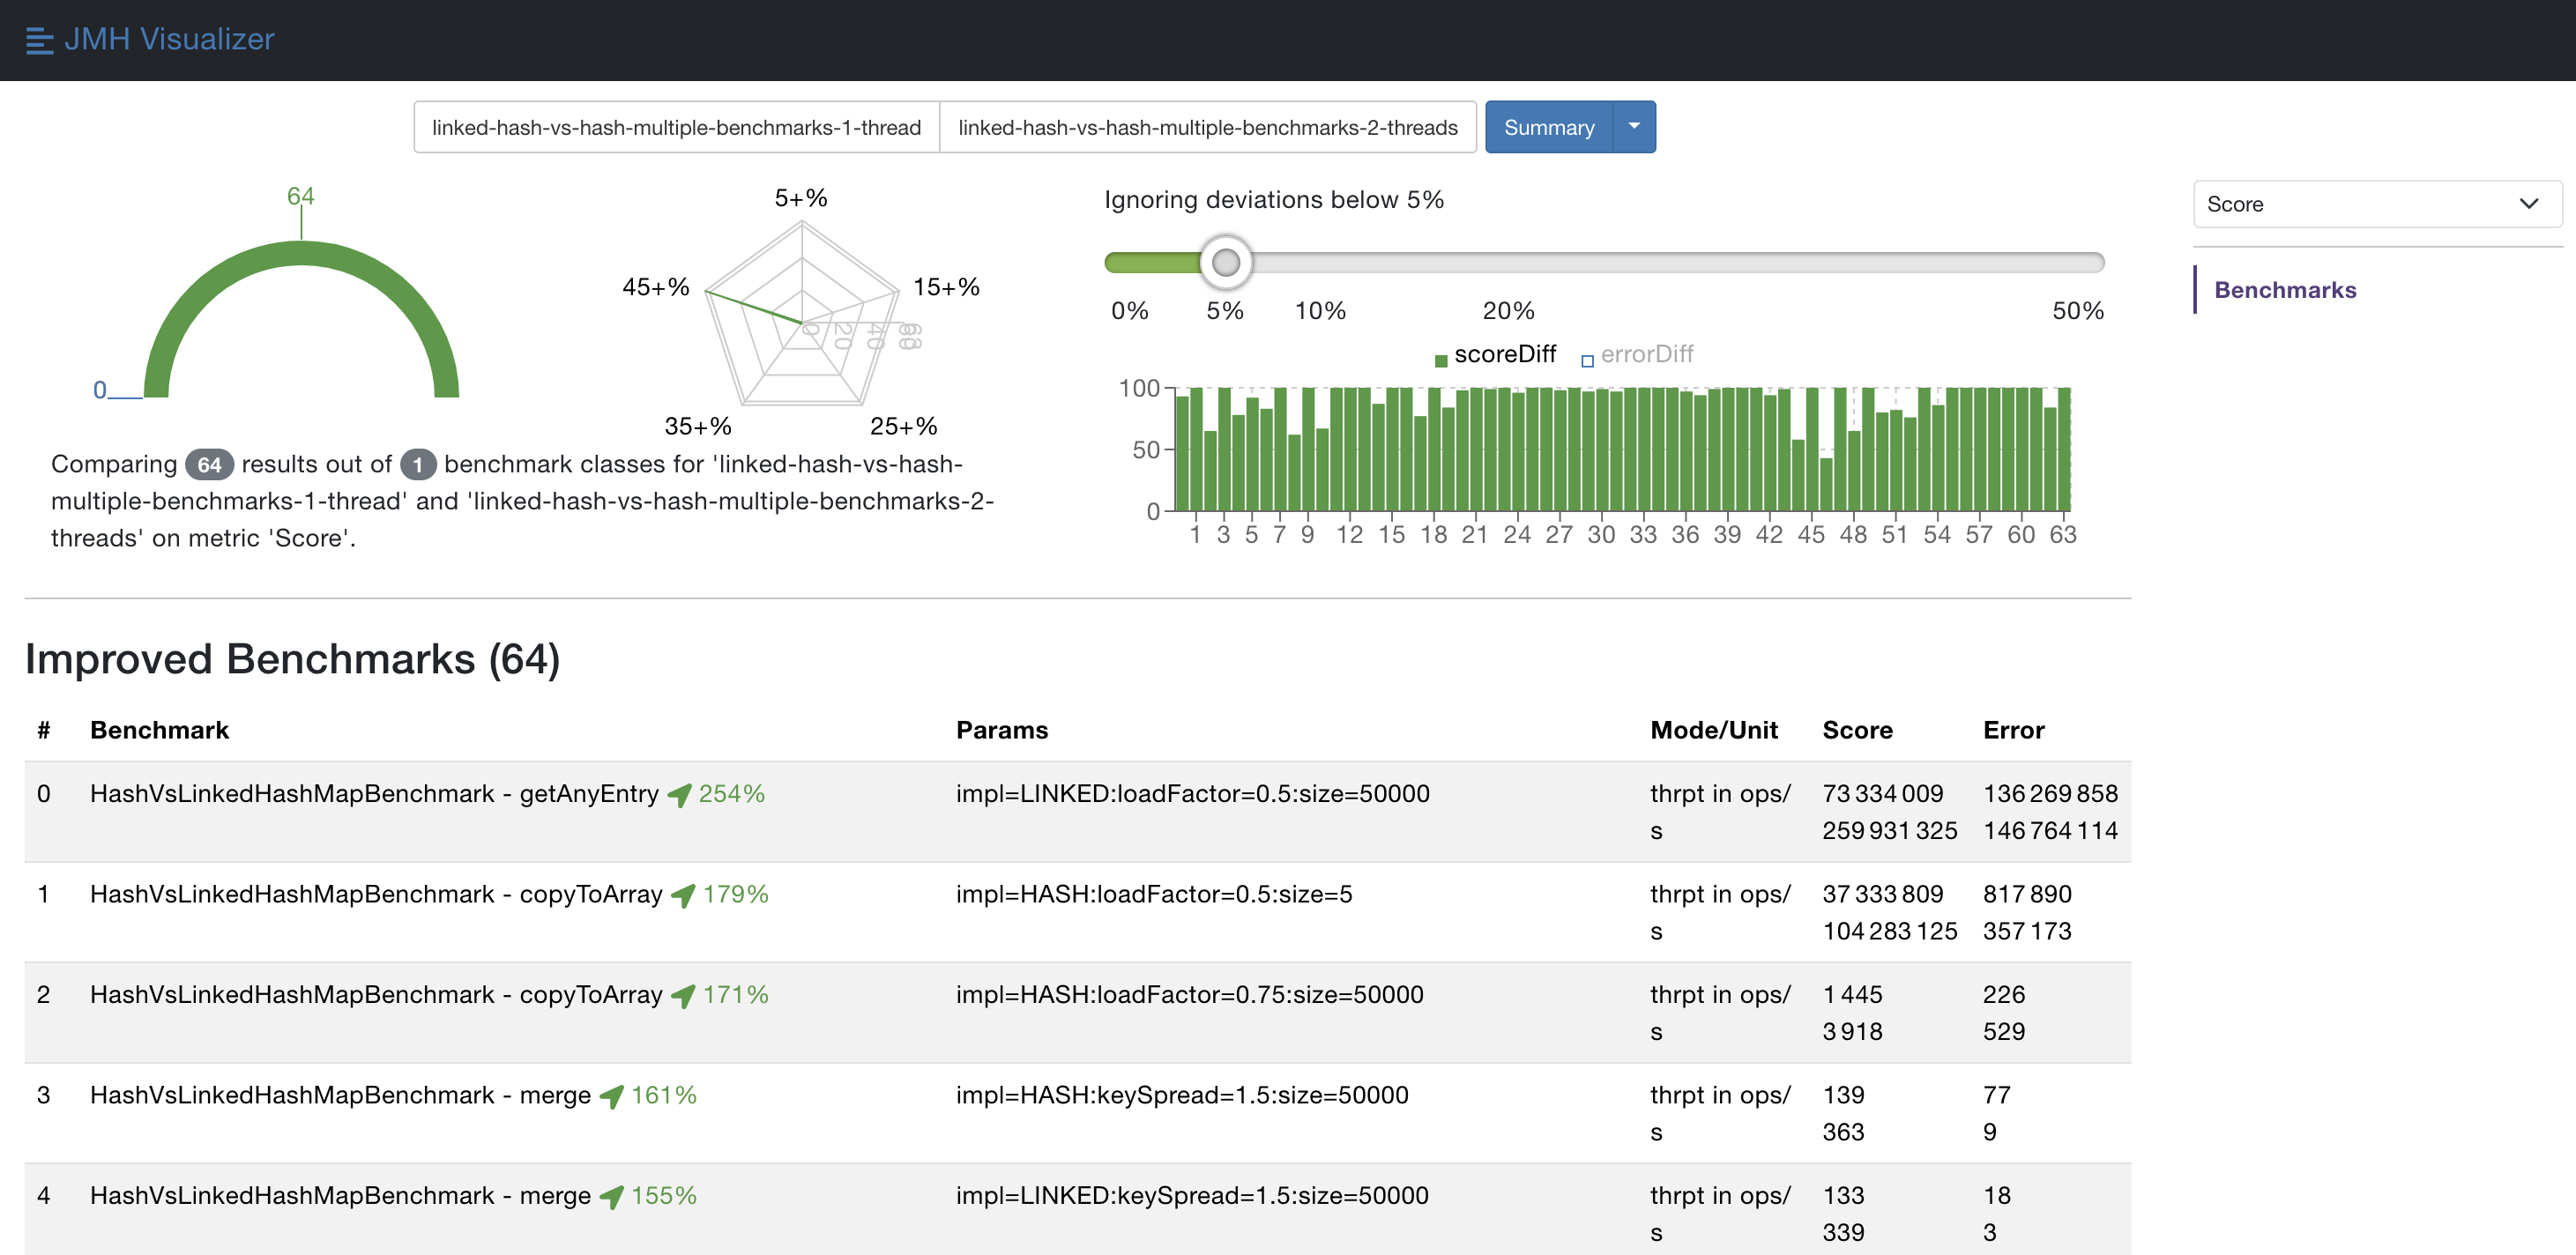
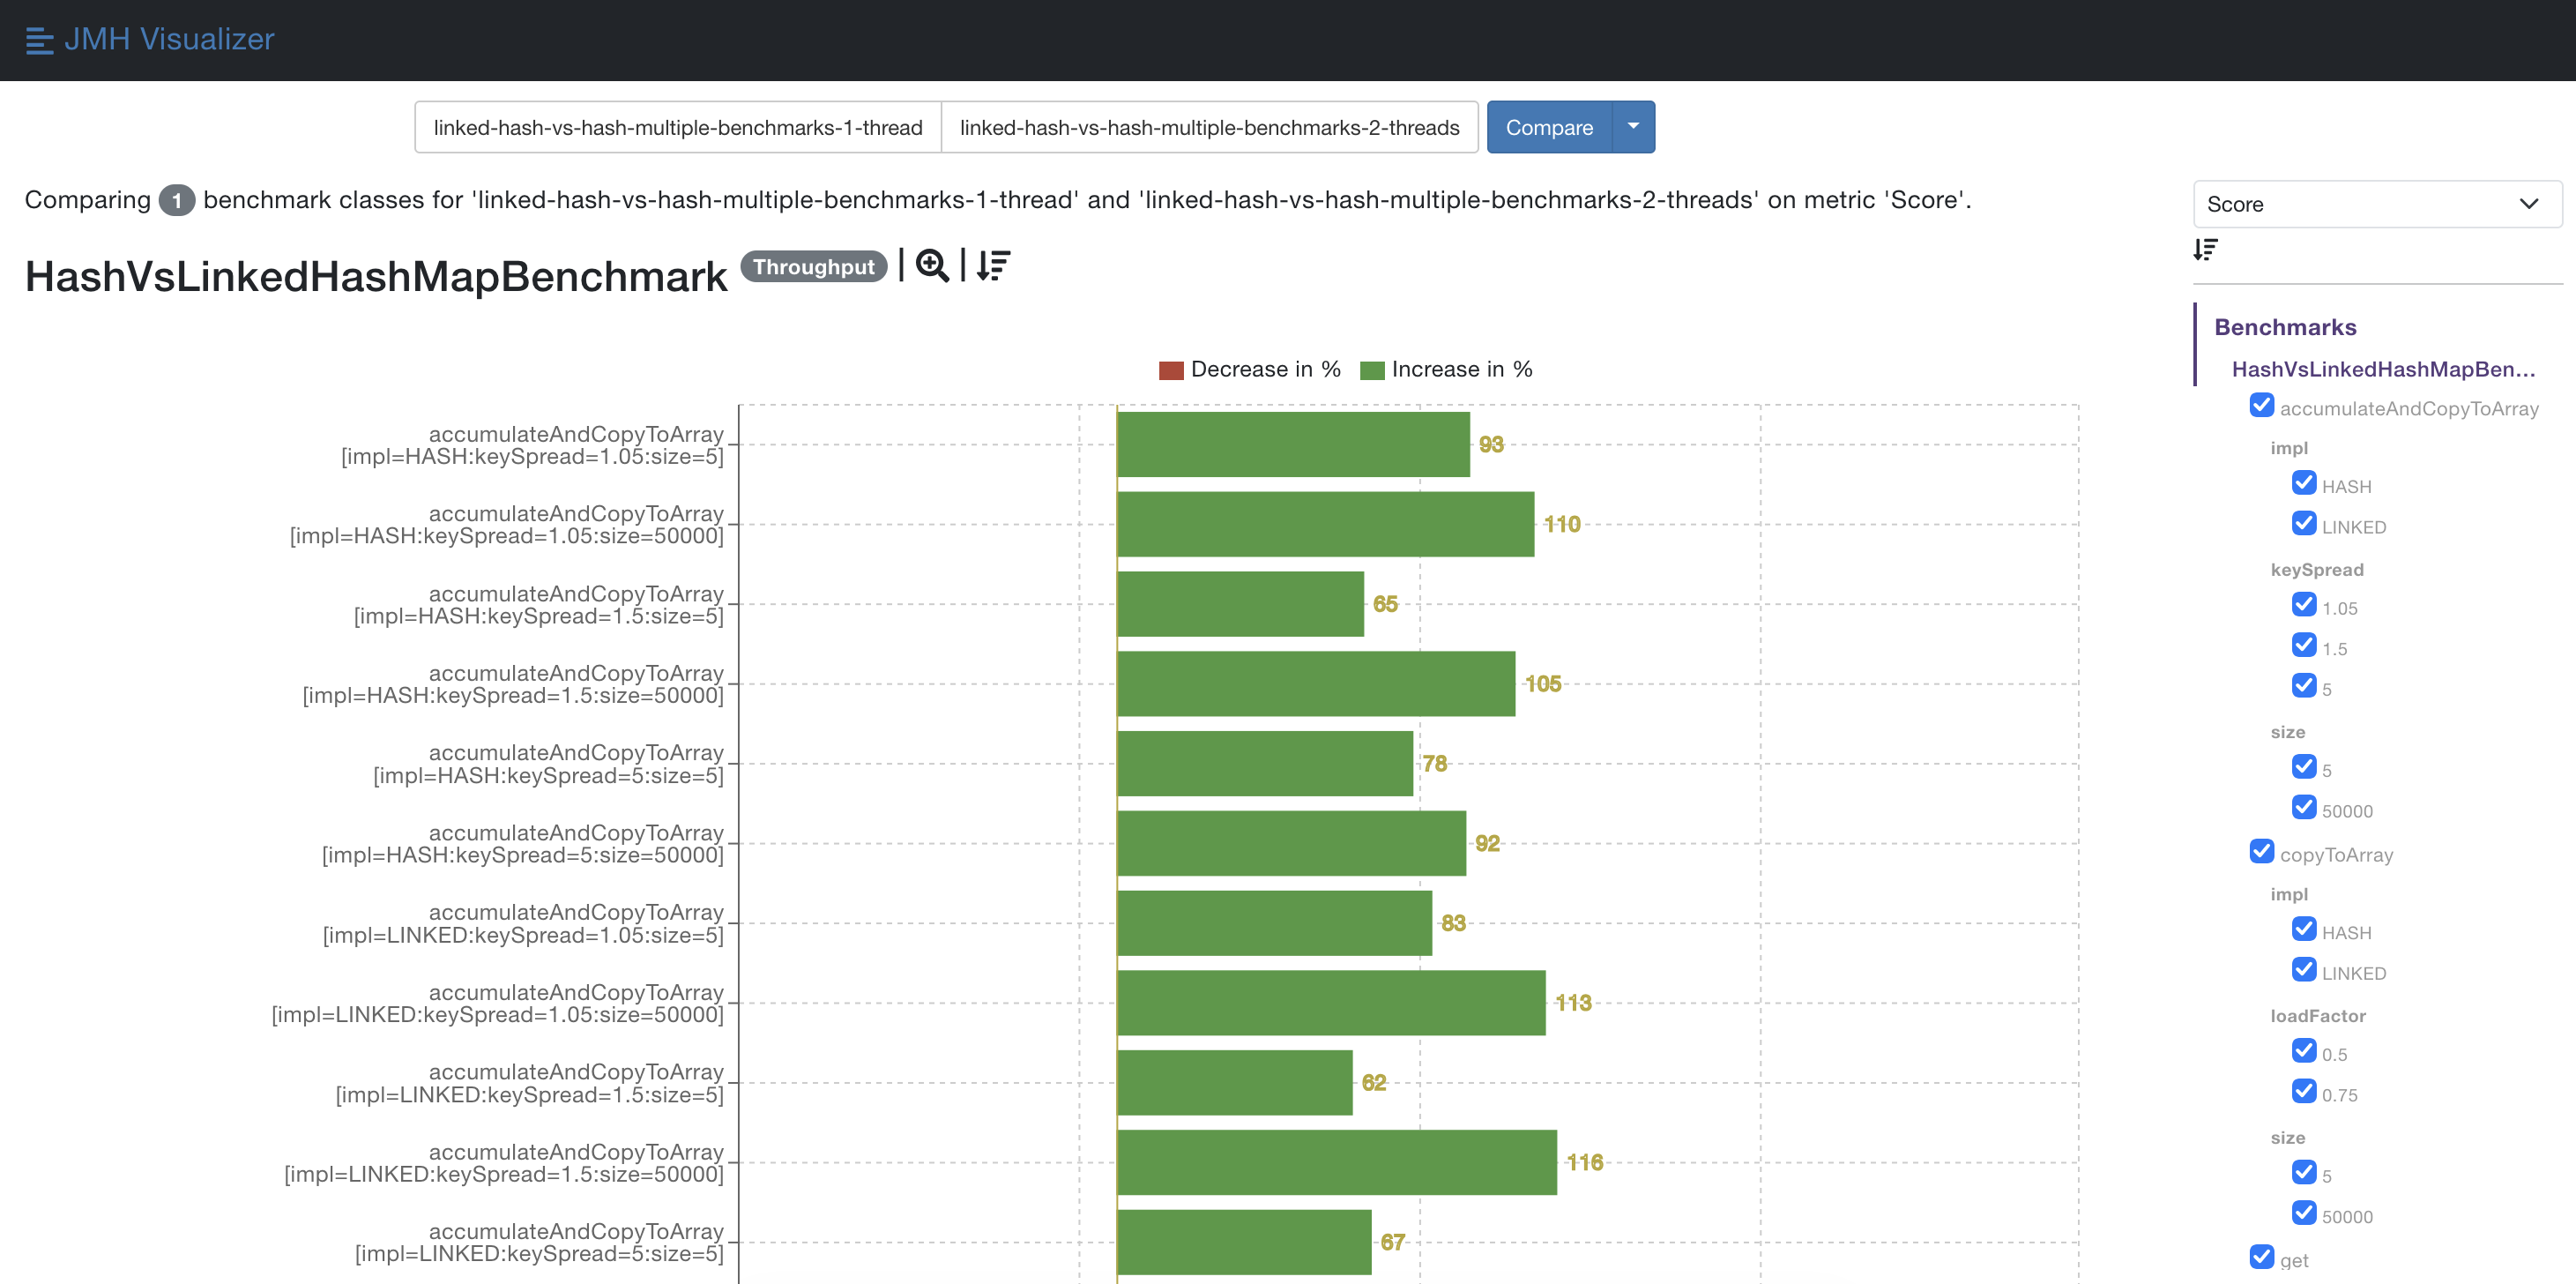
Assuming that you use the jmh-gradle-plugin, just add
jmh {
    resultFormat = 'JSON'
}
to your jmh configuration, run your benchmarks, and open build/results/jmh/results.json with
jmh-visualizer. Nothing is uploaded to any server; the tool runs
exclusively in your browser.
Additionally, you can use the jmh-report plugin, and instruct Gradle to
automatically render a report whenever you run the jmh task:
plugins {
    // Previously published under "io.morethan.jmhreport"
    id "io.github.mlangc.jmhreport" version "1.1.0"
}

jmhReport {
    // This is where the jmh-gradle plugin puts its result files by default
    jmhResultPath = "build/results/jmh/results.json"

    // Whatever you prefer
    jmhReportOutput = "build/reports/jmh"
}

// Runs `jmhReport` every time you execute your benchmarks using `jmh`
tasks.jmh.finalizedBy tasks.jmhReport
JMH Visualizer was originally developed by Johannes Zillmann who should take almost all the credit for this very useful tool. Since the related GitHub Projects seem abandoned (see here and here), I decided to carry on in my forks of both the JMH Visualizer browser application, and the related Gradle plugin.
A lot of effort has been put into keeping things exactly as they were from the outside, while not making any compromises on modernizing the underlying software stack.
There is only one extension that I’ve added to the previously existing functionality: You can now conveniently select subsets of benchmark methods and parameters. This is helpful when loading large result files containing many different benchmark-parameter combinations, like in this screencast:
Any feedback is highly appreciated and best delivered via GitHub: